The climate of Saskatoon in a glance
Saskatoon is located in the “Dfb” category based on the Köppen–Geiger climate classification (warm summer continental climate), and its climate is cold and temperate. The average temperature is highest in July (18 °C) and lowest in January (–15 °C). However, the maximum temperature can reach 32 °C in July, and the minimum temperature can reach –36 °C in January. The amount of precipitation is highest in June (62 mm) and lowest in February (18 mm) and the average annual rainfall in Saskatoon is 354 mm. The average relative humidity is highest in February (78%) and lowest in May (50%). The annual sky cover range is more than 50%, resulting in relatively low access to direct solar energy: the mean global horizontal solar radiation is highest in July (421 Wh/sq.m) and lowest in December (133 Wh/sq.m). The average wind speed is highest in April (7 m/s) and lowest in December (3 m/s) blowing from the northwest.
11 strategies for climatic design in cold regions
Minimize energy use and save money by designing your building climatically

Traditional buildings in cold climates had a compact floor–plan. Windows were faced south, and the roof was pitched for wind protection.
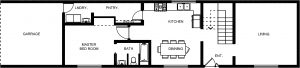
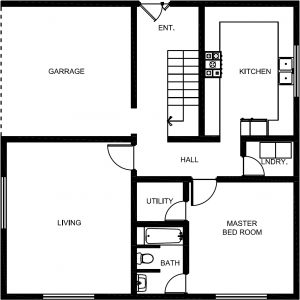
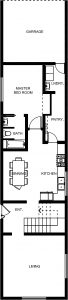
11)Unconditioned spaces (such as garages or storage areas) should be located on the side of the building facing the coldest wind (northwest in Saskatoon) to help insulation.

Locate unconditioned spaces (such as a garage) westward, to protect conditioned spaces from the coldest wind.
10)Use evergreen trees or wind–barriers to protect outdoor sunny spaces from the wind. These spaces can extend living areas in cool weather.

Protect outdoor sunny spaces by wind barriers.
9)While windows should be kept at the minimum rate, using well-insulated light-pipes can reduce electricity use by providing daytime lighting.

Light-pipes or light tubes can guide daylight indoor, without causing heat loss.
8)The building doors and windows should be protected from the cold winds, and be equipped with an airlock.
7)Air infiltration through the envelope should be managed at the minimum rate (0.5 air changes per hour). This minimum air change is required to avoid the accumulation of undesirable gases (e.g. formaldehyde or radon) indoor.
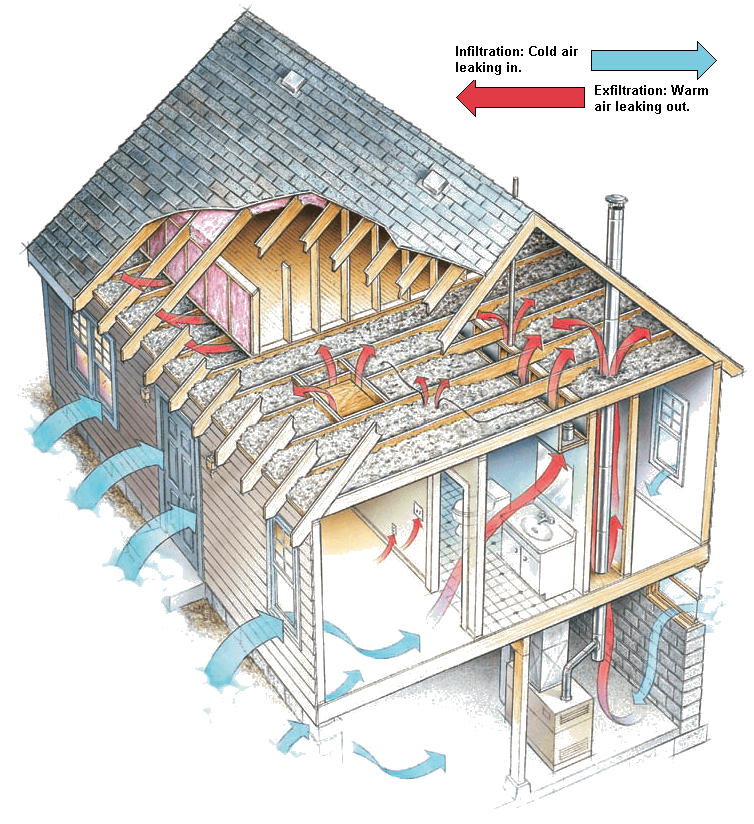
A minimum of 0.5 ach is required to avoid undesirable gases. Air leakage more than that results in heat loss.
6)Using the internal heat gain (the heat from lamps, appliances, cooking stove, and people) by considering building Air–tightness, can greatly reduce heating needs.
The heat gain from equipment, lights, and people can be used to reduce heating load.
5)Using materials with high thermal mass (massive construction) in continuously occupied buildings (e.g. homes) can minimize indoor temperature fluctuations, and may allow discontinuous heating. However, in intermittent occupancy buildings (e.g. schools, offices, or commercial buildings), using lightweight materials (with short heating up period) are recommended.

Masonry materials (e.g. brick, concrete, and stone) have high thermal mass
4)Windows should be protected from the “black hole effect” (winter night-time heat loss), using night insulation, insulating blinds, heavy draperies, or operable window shutters.
Avoiding the “black hole effect” prevents a significant heat loss during the night.
3)Windows are one of the weakest parts of building envelope from the viewpoint of thermal conductivity. So windows should be as small as possible, especially in west and east directions. Double or even triple glazed Low-E windows are more preferable to minimize heat loss.
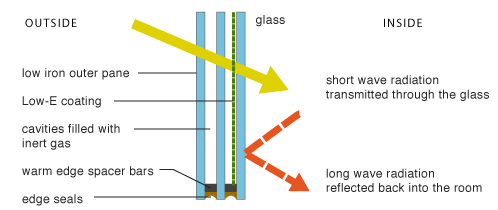 Triple windows with low-emissivity coatings and filled with a noble gas (such as Argon) can minimize heat loss from the building. the coating should be located at the internal glazing layer.
2)Insulating the building envelope is essential for minimizing heat loss. It is recommended for all external surfaces to have U–values less than 0.5 W/sq.m °K. Super insulation (extra insulation) may be cost effective and will increase occupants’ thermal comfort.

Insulation made from recycled materials (such as old denim) saves energy with low environmental impact.
1)The prime concern is to minimize heat loss from the building; so try to minimize the building’s surface–to–volume ratio. A compact building form has a lower surface–to–volume ratio and thus is more desirable.

A hemisphere has the minimum surface-to-volume ratio. That is why Eskimo igloos are built as a hemisphere.
What can we do for you?
The priorities of the above-mentioned strategies may differ from place to place (affecting from microclimatic conditions). We can find you the most energy and cost-effective strategies using whole building energy simulation, and tell you which strategy is the best to be applied in your building.
An example of simulation results:
Test model-A: maximum use of southward windows
Test model-B: least surface–to–volume ratio and maximum compactness
Test model-C: linear form with the minimum southward surface
As was mentioned earlier, there are many different strategies for climatic design in cold climates. Accordingly, the designer may be confused in deciding which strategy is better to be used? This problem would be harder while these strategies are in contrast with each other, such as minimizing the surface-to-volume ration (which leads to a cubic building form) and maximizing the use of southward solar radiation (which leads to a linear building form with maximum windows facing south).
To determine which strategy is better to be used in Saskatoon, three different models were simulated using DesignBuilder® software. Total floor area, building materials, and other specifications of these three buildings were similar, while one of them had a cubic form (test model type B), one with the maximum south-facing windows (test model type A), and one with linear form with minimum south-facing windows (test model type C). All the mentioned models were simulated using DesignBuilder® software. The simulation results showed that between these three models, test model-A had the best and test model-C had the worst energy performance. Although there was not a significant difference between test model types A and B. However, test model-A had less heating and cooling loads and fewer discomfort hours. Test model type C had the most heating and cooling loads and produced more CO2 and thus had the worst results. A summary of the simulation results can be seen in Table 1.
Table 1: Summary of the simulation results
| Test model-A | Test model-B | Test model-C | ||
| Whole building | dimensions | 5.4 (m) × 24.2 (m) | 11.4 (m) × 11.4 (m) | 24.2 (m) × 5.4 (m) |
| Total area | 130 (m2) | 130 (m2) | 130 (m2) | |
| External walls | Total area | 177.6 (m2) | 137.2 (m2) | 177.6 (m2) |
| U–value | 0.351 (W/m2 °K) | 0.351 (W/m2 °K) | 0.351 (W/m2 °K) | |
| External windows
(double clear glazed) |
Total area | 8 (m2) | 8 (m2) | 8 (m2) |
| U–value | 2.7 (W/m2 °K) | 2.7 (W/m2 °K) | 2.7 (W/m2 °K) | |
| System loads | Heating | 15034.4 (kWh) | 15702.2 (kWh) | 15845.0 |
| Cooling | –152.3 (kWh) | –256.1 (kWh) | –261.1 | |
| Solar gain from the windows | 4942.2 (kWh) | 5167.9 (kWh) | 4734.1 | |
| Total discomfort hours | 3082.8 (h) | 3119.9 (h) | 3061.2 | |
| CO2 emissions | 9365.4 (kg) | 9487.0 (kg) | 9735.3 | |
About me
M. Haghshenas (B.Sc., M.A., Ph.D.)
Architect and designer with a special interest in sustainability
Contact address: mohaghshenas[at]yahoo.com